Progress on Goliat Dashboard: Initial Workspace View

We want to thank the community for their support and suggestions during the development of Goliat Dashboard. This feedback has been fundamental in advancing the project and improving its functionality.
Overview of progress
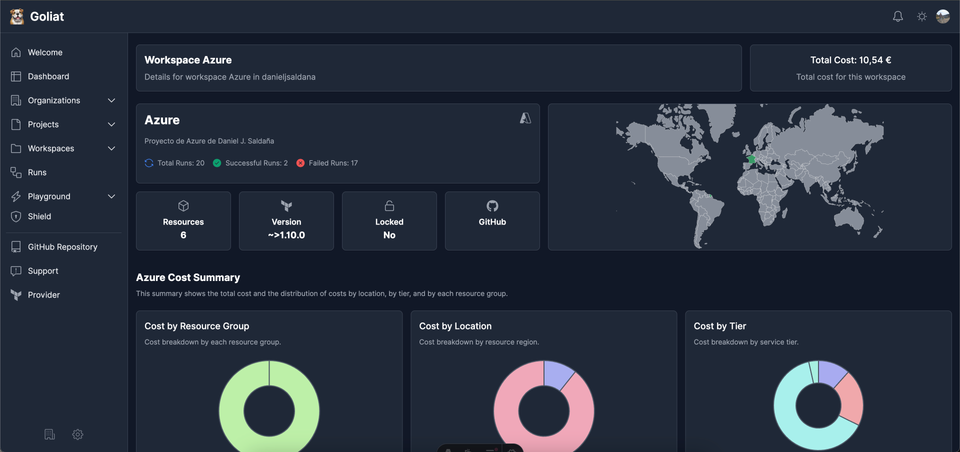
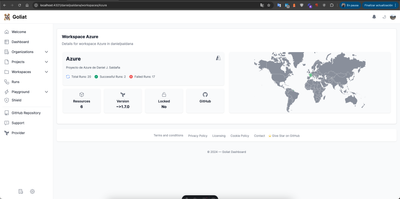
In this first phase of the project, we have completed an initial view focused on providing detailed information about workspaces and their associated metrics. This view allows users to visualize relevant data directly and in real time.
Implemented Features in the Workspace View
The current workspace view includes the following metrics and features:
- General metrics:
- Total runs: Total number of executions recorded in the workspace.
- Successful and failed runs: Classification of executions as successful or failed.
- Total resource cost: Breakdown of the cost associated with the workspace's resources, grouped by tags.
- Resource count: Total number of resources deployed in the workspace.
- Terraform version: Information on the Terraform version used.
- Workspace state: Identification of the workspace state, including whether it is locked.
- Quick access to GitHub: Button that quickly links to the associated GitHub repository.
- Data visualization with graphs:
- Cost by Resource Group (RG): Graphical representation of the cost of each resource group.
- Geographic distribution: Visualization of costs by resource location (e.g.,
FR Central,ES Central). - Tier classification: Cost analysis by different levels or categories, such as
Premium SSD Managed Disks,BS Series, among others. - Resource Information: Details and classifications of deployed resources.
Associating Runs and States with external Resources
We are currently exploring how to associate runs and states with resources generated outside of Terraform Cloud. This task presents certain challenges, and we are evaluating the best way to approach it to cover the maximum number of platforms, such as GitHub Actions, Azure DevOps, or deployments from local environments.
Our goal is to provide a flexible and efficient solution that captures and syncs this information automatically, regardless of the deployment environment used.
Sample data Output
Through the developed APIs, it is possible to obtain detailed information about the resources. For example, a typical JSON output includes:
{
    "organization": "danieljsaldana",
    "identifier": "Azure",
    "resourceGroups": [
        {
            "resourceGroupName": "danieljsaldana",
            "totalCost": "10.54 €",
            "costByCategory": {
                "Bandwidth": "0.09 €",
                "Event Hubs": "1.12 €",
                "Storage": "2.18 €",
                "Virtual Machines": "6.77 €"
            },
            "costByLocation": {
                "FR Central": "1.13 €",
                "ES Central": "9.41 €"
            },
            "forecastTotalCost": "11.52 €"
        }
    ]
}
This data allows for greater transparency and control over resources and their associated costs.
Next steps
Although the workspace view is complete, project development is ongoing. The next phases will focus on:
- Implementing 0perational features: Enhancements in managing and controlling deployed resources.
- New integrations: Support for additional cloud services such as Azure and AWS.
- AI-Powered enhancements: Integration with OpenAI to offer detailed analysis and automated recommendations.
- User experience optimization: Improvements in real-time updates and overall platform usability.
- Provider challenges: Continuing to explore how to embed all the logic for run and state synchronization directly into the provider to overcome current limitations.
Project status
The Goliat Dashboard project is currently in active development. We are committed to delivering a robust and efficient tool that facilitates real-time infrastructure and resource management.
For more details about the project and future updates, you can visit the GitHub repository or watch a demo on our YouTube channel.

